How does it perform?


- Details
- Published on Sunday, 03 January 2016 10:32
- Hits: 7066
The performance of the collector of course is very dependent on the daily weather. If it is sunny it will perform much much better then on a cloudy day. At the same time also the hours of daylight have an enormous difference in performance; In the winter days are very short and nights are long and the other way around.
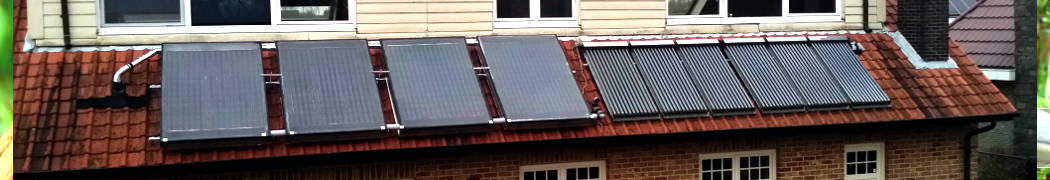
The collector shown here, is located a little west of Antwerp in the North of Belgium. As a reference; That is more North then the city of Vancouver.
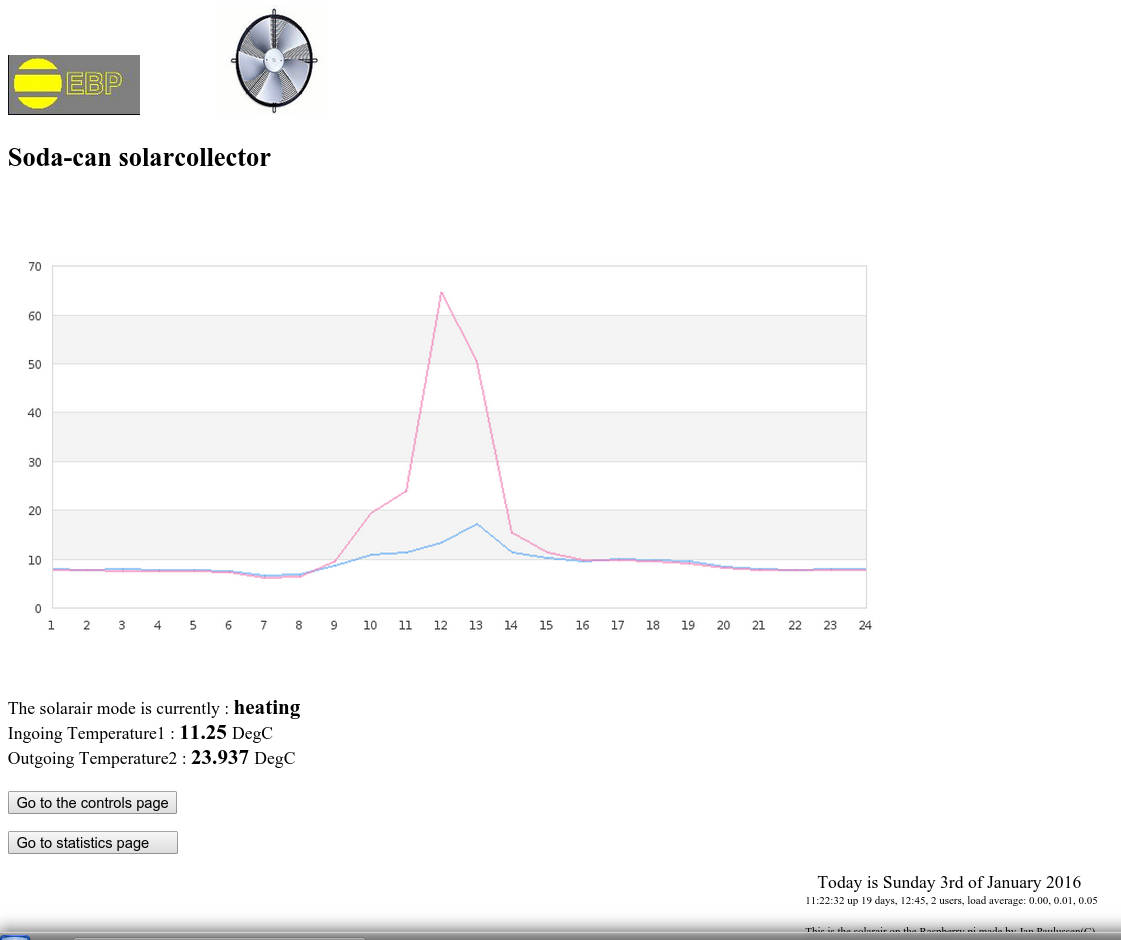
Below the narrow graph can be seen on a reasonable sunny day just after New Years day in the middle of winter. The collector still gets over 70 DegC, but only for a few hours...
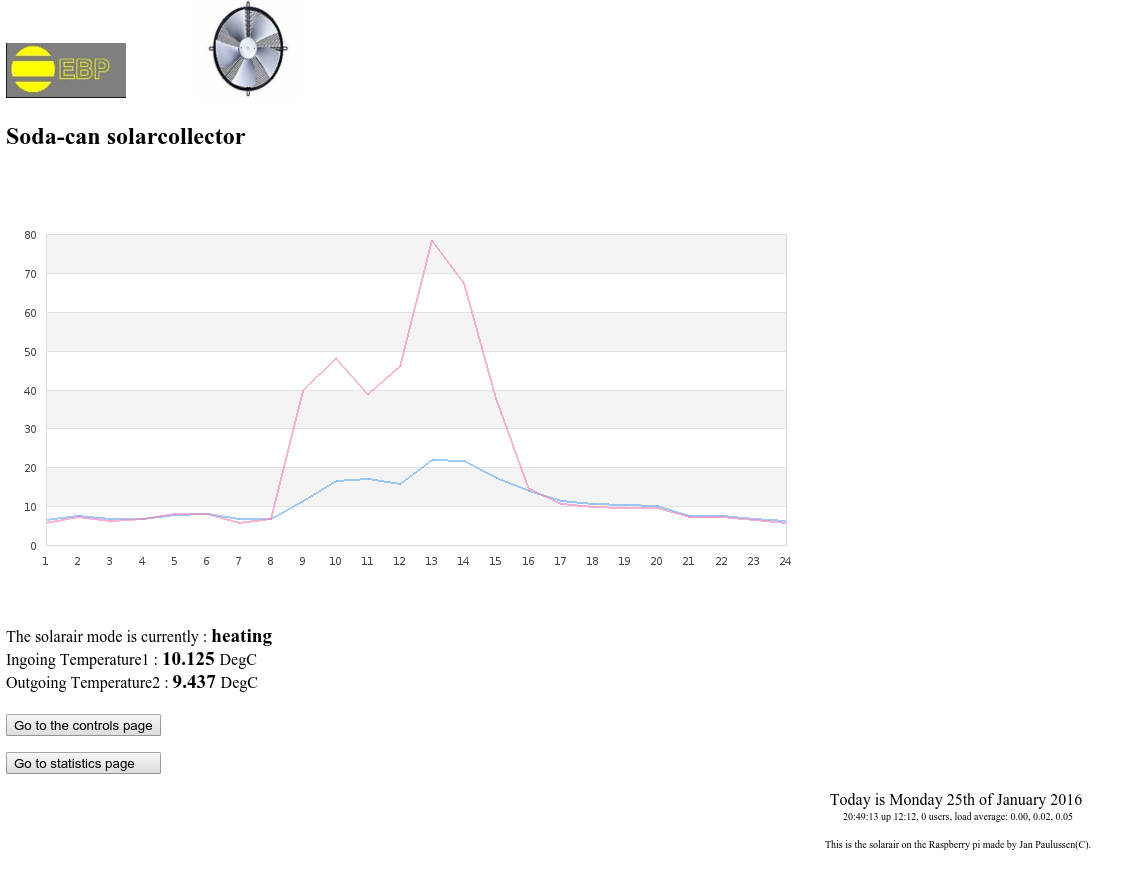
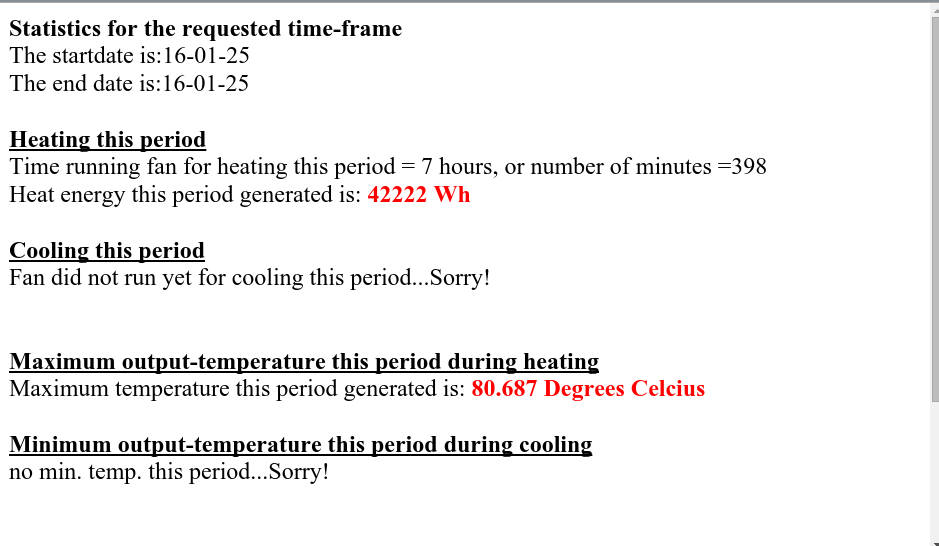
Right next to it is a similar graph of a couple of weeks later, still mid winter the 25th of Januari, but where the days are a little bit longer, and hence performance is already much better. Also the angle of the sun is improved already. The temperature goes higher and the width of the graph is wider. (The dent in the graph is because a tree is blokking some sun in the middle of the day.
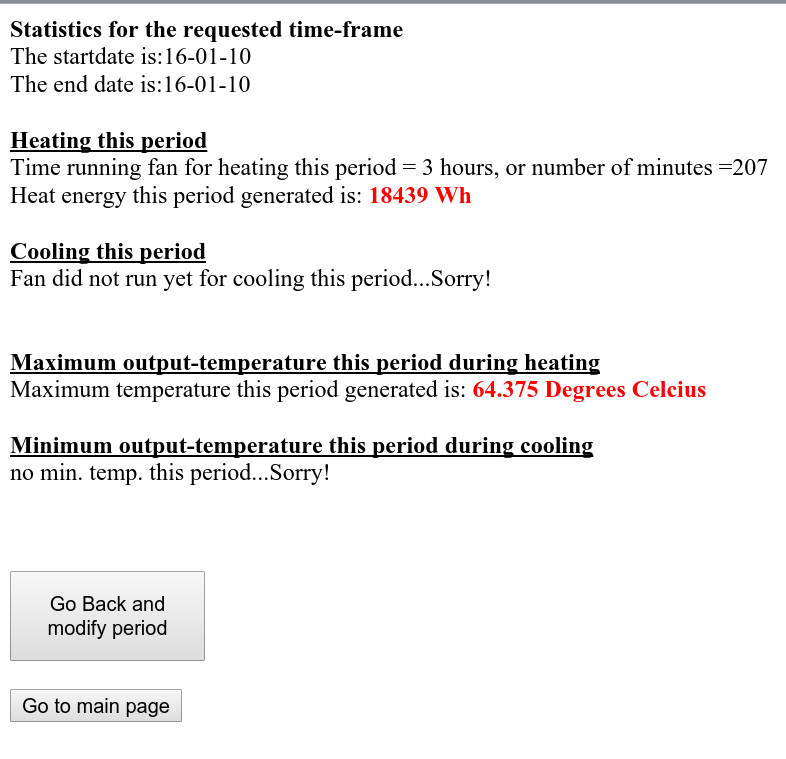
Below you can see the calculated data for the same dates... As you can see it is a difference of about 18 kWh of energy versus 42 kWh. More the double already. It has to be said that both dates were very sunny days. Other days the output remained zero for a full day!...
Yet since it is more the hours of sun then really the temperature that defines performance, the best result is to be expected in the spring time. At the spring the days are the longest, while the heat is needed the most. In the summer days are already shortening and the heat is less needed. By comparison to graphs of other systems (like PV-cells), it seems save to say that at the end of spring the expected output will be 10x the output of winter time. Once the graph of spring time comes available it will be posted.